Elasticsearch is an open-source, RESTful search engine. It’s known for its scalability, high availability, and easy-to-use API.
Although Elasticsearch uses JSON over HTTP to manage the objects and structures within a cluster, it can be difficult to know exactly what’s going on without exploring the indices, documents, and mappings in it.
This is where this extension comes in handy. You can use it to look at your Elasticsearch objects, including indices, documents, and mappings. You can also read or change values for individual documents. This extension will work with any version of Elasticsearch 1.x or above.
Chrome Extension For Elasticsearch
ElasticSearch-head is a management plug-in that can connect to the ElasticSearch search engine and provide a visual operation page to perform various settings and data retrieval functions on the ElasticSearch search engine. For example, write RESTful interface style requests on the head plug-in page. You can add, delete, modify, check, create or delete indexes and other operations on the data in ElasticSearch. It is similar to using the Navicat tool to connect to a relational database such as MySQL to operate on the database.
For the installation of the Elasticsearch Head plug-in, you can visit github:
https://github.com/mobz/elasticsearch-head
For the new version of Elasticsearch 7.x , The easiest recommended installation is: install the Elasticsearch head chrome plugin.
The following is the complete installation process of the Elasticsearch head chrome plugin.
1. Elasticsearch Head plug-in download:
https://download.csdn.net/download/vbnetfun/11574864
elasticsearch-head-chrome plug-in, Google extension The program can be used immediately after importing without any other configuration, which is convenient and quick.
2. After the download is complete, unzip it.
3. Open the extension window of the Chrome browser.
is shown in the figure below.
4. Click the [Load decompressed extension] button and select the elasticsearch-head-chrome plugin directory that was just unzipped.
Then the Elasticsearch Head Chrome plug-in can load normally and work.
5. Use Elasticsearch Head Chrome plug-in.
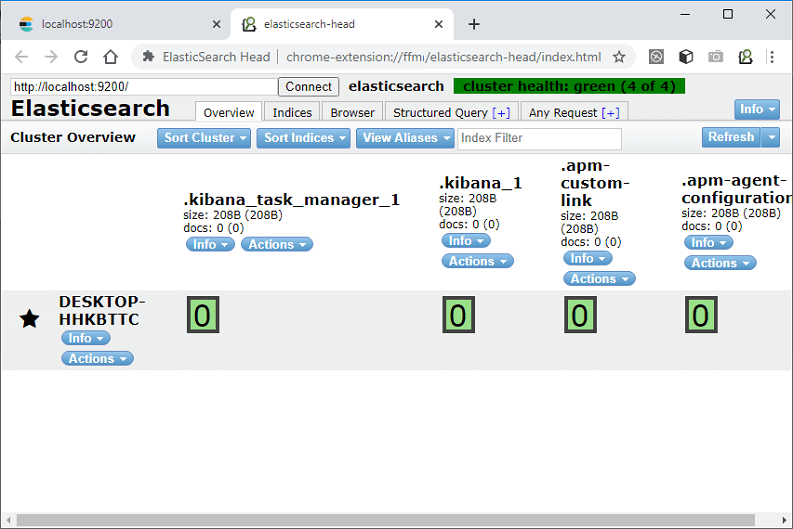
Click the plug-in icon, and http://localhost:9200/ is automatically opened by default. You can view the index information in the Elasticsearch cluster.
The picture above shows the effect of the Elasticsearch cluster overview page. The following is a brief description.
(1) Cluster health value.
Elasticsearch cluster actually has a special index to measure the health of the index, divided into three levels:
green, green. This means that all primary and replica shards have been allocated. Your cluster is 100% available.
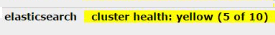
yellow, yellow. All the main shards have been sharded, but at least one copy is missing. No data will be lost, so the search results are still complete. However, your high availability is weakened to some extent. If moreIf many fragments disappear, you will lose data. So think of yellow as a warning that requires prompt investigation.
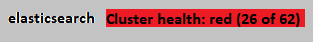
red, red. At least one primary shard and all its replicas are missing. This means that you are missing data: the search can only return part of the data, and the write request assigned to this shard will return an exception.
If there is only one host, the health status of the index is also yellow, so the picture above is shown as yellow. Because there is no other host in the cluster that can replicate a host, this is an unhealthy state, so the cluster is also very necessary.
(2) The index in the cluster (index)
indicates the index (index) that has been created in Elasticsearch, including the name of the index, the size of the index (size), and the amount of indexed data (docs), And through [Information] and [Action] you can view index information or create an alias for the index.
(3) Elasticsearch node.
The Unassigned with an exclamation mark in the above figure indicates an unassigned node, and the one with an asterisk indicates the master node. Its node name is THINKPAD-T460P, and the node information can be viewed.
(4) Index fragment
Elasticsearch data is stored in these fragments.
(5) View information related to Elasticsearch and refresh the head plugin.
If you view the Elasticsearch version information, as shown in the figure below:
Elasticsearch cluster cluster information.
(6) Index page
Index page can see the indexes that have been created in the current Elasticsearch. The indexes here are similar to the ones in the traditional relational database. Table, and you can create a new index on this page.
(7) Data browsing page
The data browsing page can view the data of all index segments.
(8) Basic query and compound query page
These two pages are used for data retrieval. The basic query page only provides simple queries and cannot modify data, compound queries The page provides requests for writing RESTful interface styles to perform various addition, deletion, modification, and other operations requests on the data in Elasticsearch. The pages are as follows:
Basic query page
Basic query page can be checked Simple query of data.
There are three query keywords: must, should, must_not.
must clause: the document must match the must query condition, which is equivalent to
should clause: the document should match one or more of the should clause queries;
must_not clause: The document cannot match the query condition, which is equivalent to “!=”;
Composite query page
The composite query page provides requests for writing RESTful interface style, Use json for complex queries, you can also send put requests to add and update indexes, useThe delete request deletes the index and so on to perform various operation requests such as addition, deletion, modification, and other operations on the data or index in Elasticsearch.
Head plug-in writing json sending request is more complicated and inconvenient. You can use postman or the API provided by the Kibana module to send the request to realize the data and data of ElasticSearch. Indexes are added, deleted, modified and checked.
how to use elasticsearch head chrome plugin
Elasticsearch is a background tool that can only store data but cannot visualize it. So, it requires a data visualization tool or plugins to execute query and display data. There are various plugins available for elasticsearch users, such as Kibana, analysis-icu, head plugin, etc. It provides a developer interface for developers. You can either install plugins or data visualization tool, which you prefer.
In this chapter, we are going to use elasticsearch head extension of elasticsearch plugin in chrome web browser. It is a developer tool.
What is Elasticsearch head?
Elasticsearch head is a data visualization plugin that provides an attractive interface to the elasticsearch users. It allows us to perform CRUD operations on data. It is a visualization tool used as Elasticsearch plugin. It is also available as an extension in chrome web store. You can add this extension directly to your browser. So, you do not need to install it through the command prompt.
Although, Kibana is also a visualization tool that works with Elasticsearch in ELK stack for visualizing data. Elasticsearch head plugin saves us for installing Kibana (visualization tool) with its more than 50,000 files.
Note: This plugin requires that the elasticsearch server must be running before using it.
In this tutorial, we will add the elasticsearch-head plugin extension to the chrome web browser instead of installing it.
Add elasticsearch head plugin
In previous page, we see that Elasticsearch was running successfully. Now turn to add the elasticsearch-head plugin extension in browser. Follow the below steps to add elasticsearch plugin extension to chrome.
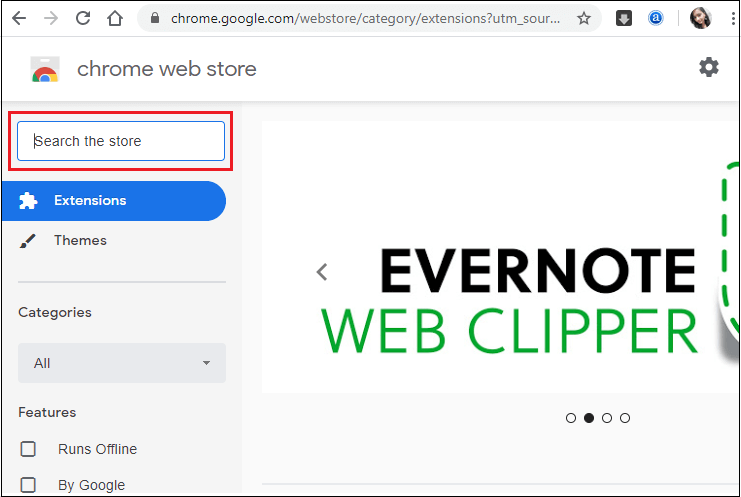
Step 1: Open the web browser and go to the web store inside the app section.
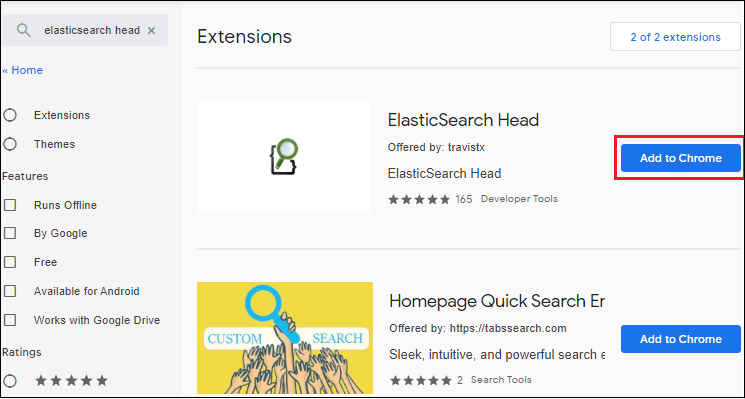
Step 2: Here, search for elasticsearch head extension. Type elasticsearch head in the search box.
Step 3: Click on the Add to Chrome button.
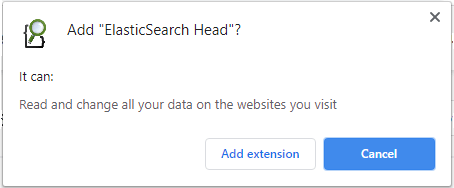
Step 4: Click on Add Extension and move ahead.
Step 5: Once the plugin is added to the chrome successfully, you can directly use it from the following icon as shown in the below screenshot.
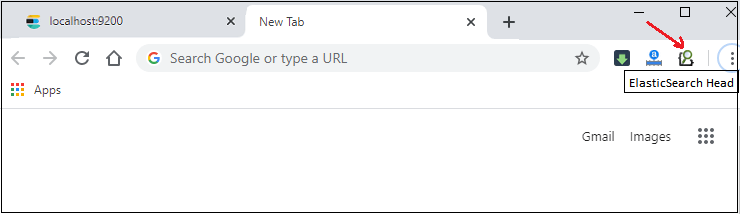
Here, click on the head plugin icon.
Step 6: A web user interface will display on the screen. See the screenshot below, the cluster is not connected yet. Click on the Connect button to connect elasticsearch with cluster.
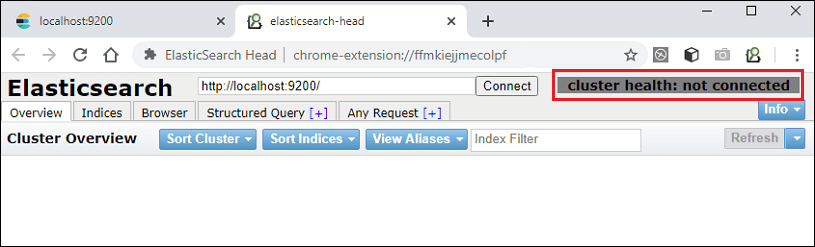
Remember that Elasticsearch must be running before using the elasticsearch-head plugin.
Step 7: Now, it is connected with elasticsearch server successfully.
This is an interactive interface for elasticsearch users, where they can execute queries. Click on Any Request button to perform queries.
UI Familiarity – Home Page
The screen that displayed after connecting with elasticsearch server is the user interface of elasticsearch head plugin to which a developer interacts. It contains various components. So, let’s explore the head plugin to understand them. Following is the home page of the interface.
1. Connection bar
The connection bar contains the URL to connect with elasticsearch server. This URL specifies the connection string containing the host machine and port number of elasticsearch. Here, we are using localhost as a host machine and 9200 default port number of elasticsearch. The connection URL is http://localhost/9200/
2. Cluster health
It shows the health of the cluster. The health status is defined with three colors: red, yellow, and green, where each color has a different meaning.
Red – The red color indicates that some nodes or primary shards in the cluster are not available yet. All or some of the primary shards are not ready
Yellow – The yellow color indicates the some or all shards are not allocated to any node.
Green – If all shards are ready and allocated to any node, the color will be green.
The learn nodes, clusters, and shards see the previous tutorial.
3. Info
Info is a drop-down tab that provides different options to see the stats on cluster health, nodes, plugins, templates, and some other things related to elasticsearch.
4. Overview
This shows which tab the UI is currently on.
5. Index name and other information
This section shows the index name, size of the index, and number of documents present in index.
6. Info and action tab
This shows the info and action tab. The info tab provides a list of metadata, where “mapping” is one of the most useful metadata. Each index has metadata and allows some action to be performed. Metadata resides inside the info tab.
7. Node list
In the earlier tutorial, we already discussed that Elasticsearch is a distributed system that can be deployed on multiple nodes. It shows the list of nodes, where info and actions provide options to view the node details.
8. Shard info
An index can be divided into shards, which are the basic storage unit of elasticsearch. These shards can be further distributed among several nodes or a single node. You can get the state and information about each shard by double-clicking on it. Here are 5 shards on a single node for the index “schools“.
UI Familiarity – Request Page
Request page is another page of elasticsearch-head UI that allows the user to perform the CRUD operation. It is an important page of elasticsearch-head because the requests and queries are made at this page. Click on Any Request button to move on the request page. Request page looks like as shown in below screenshot:
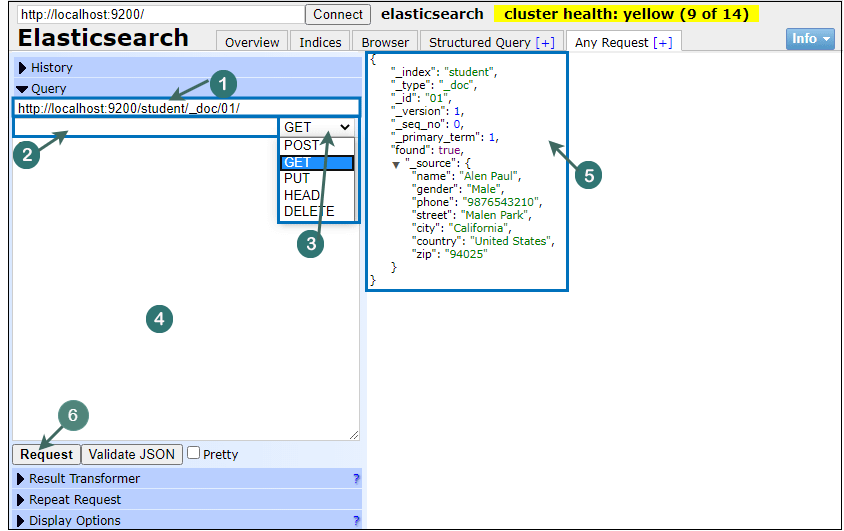
1. Request String
The request string is a place where the request is made. It also contains the connection URL of elasticsearch. We add our request string in this connection URL. You can see the index name, type name, and id of the document in the above screenshot.
2. API Column
In API column, we specify the API (if any) to interact with elasticsearch. The API column can be blank. In the above screenshot, we have not called any API methods with the request made.
3. Request type specifier
It is a drop-down that contains the list of type of requests. POST, GET, PUT, HEAD, and DELETE are the request types.
4. Query space
The Query space is a place where we can provide the query associated with the request. In other words, we can say that if there is any query associated with request, we can place it here (in query space section).
5. Response area
The response area is a block where the output of the request is generated. It displays the response of the request made by the user.
6. Request button
The Request button helps to process the requests. So, after made a query request click on the request button to execute it.
Now, we will create and execute request queries using this elasticsearch plugin.
Conclusion
Let us know your thoughts in the comment section below.
Check out other publications to gain access to more digital resources if you are just starting out with Flux Resource.
Also contact us today to optimize your business(s)/Brand(s) for Search Engines