The best marketing analytics tools allow you to track and analyze your website’s performance.
With the right tools, you can determine how many visitors are coming to your website, how many of those visitors are converting into leads, how many of those leads turn into customers for your business, and much more.
These tools enable you to find out what works on your website and what doesn’t work, as well as what aspects of your site could use improvement.
Best Marketing Analytics Tools
Here is the list of the top marketing analytics tools that you can consider incorporating into your marketing strategy:
1. Google Analytics
This is a basic and free website analytics tool provided by Google. You can use it to track the traffic on your website, know where your web visitors are coming from, how they came to know your website, the amount of time they spent on your website, etc.
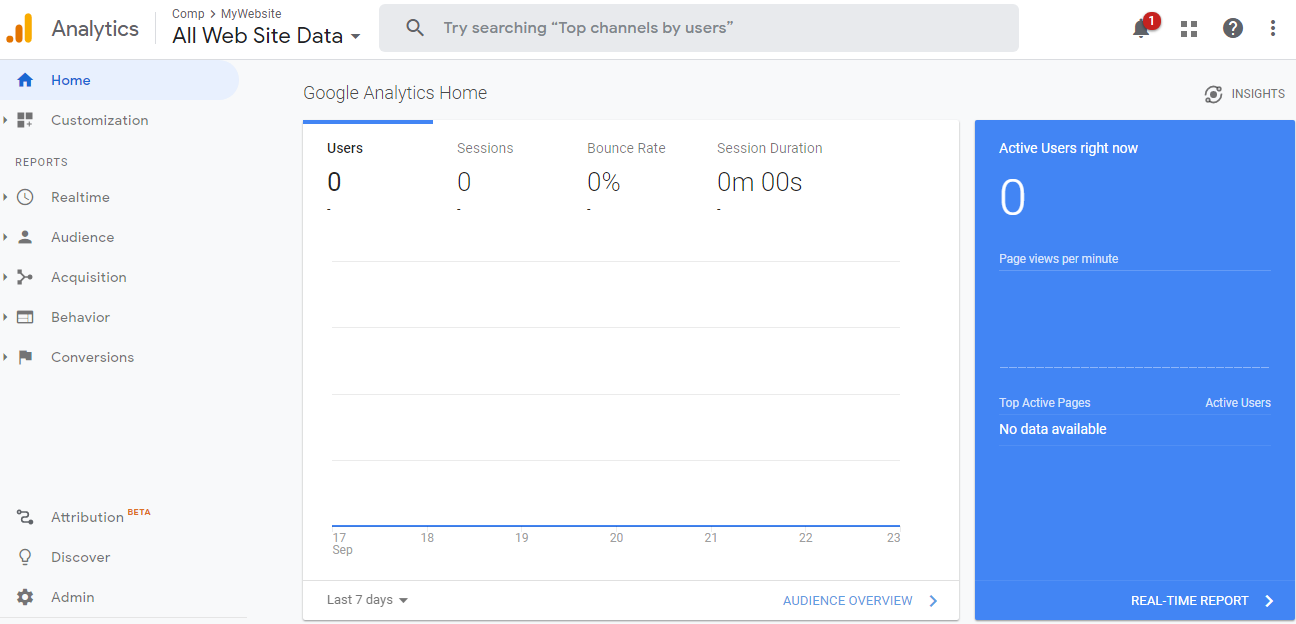
Google Analytics can also be integrated with other tools like Google AdWords and Google Data Studio for a deeper analysis of your marketing data. However, it is complex to define and track new conversions, and it doesn’t provide an option to track individual user sessions and know how users actually use your site.  Download the Whitepaper on Automating Data IntegrationLearn the key benefits of automating Data IntegrationGET GUIDE FOR FREE
The basic version of Google Analytics is free and is fit for most companies. It also comes with a premium version that costs about $100K annually with advanced data analytics capabilities and full support from Google.
2. MixPanel
The goal of MixPanel is to track the events on your website, mobile app, or product. This way, you can know what users are doing on your mobile app or website.
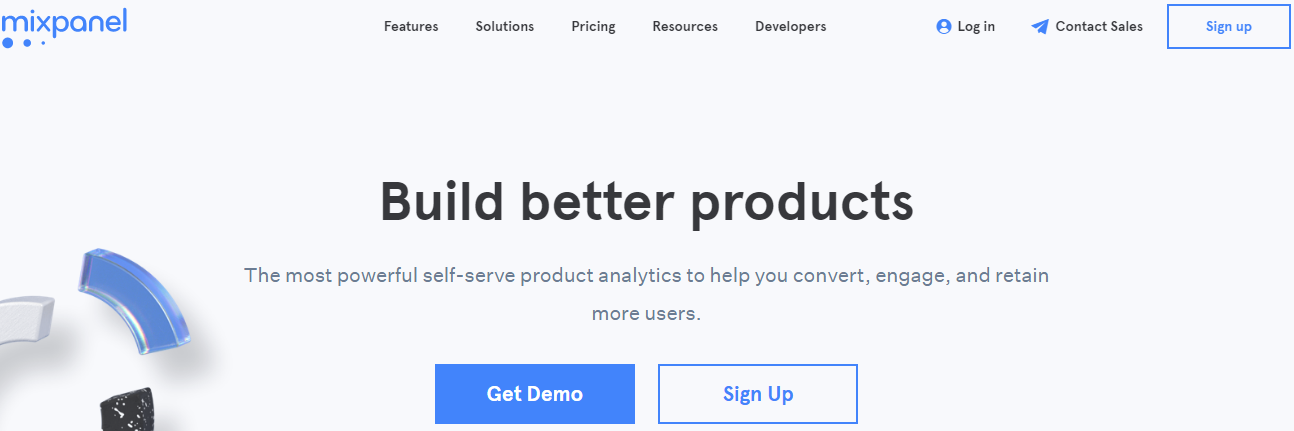
Once you add an event to MixPanel, you will see the trends, count, the users who used them and in what order. It also offers funnels and A/B testing for different versions of your mobile app. MixPanel expects you to add the events that you need to track and focus on.
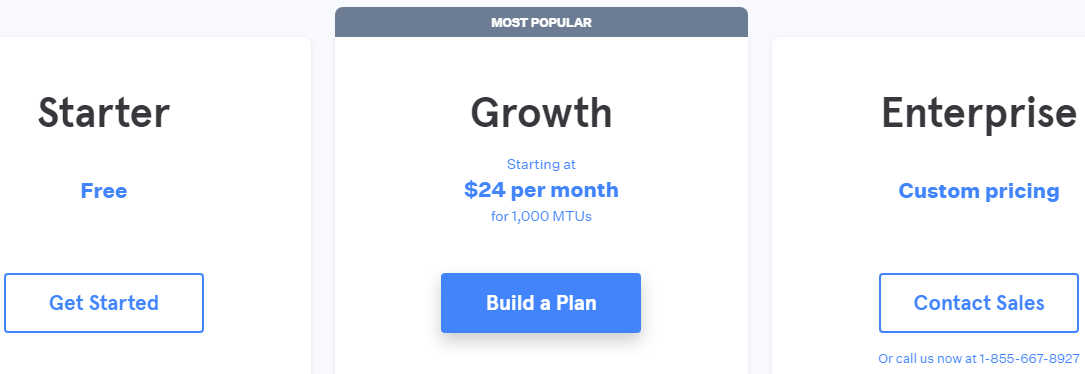
You can do this using a visual selector or by adding code annotations. After the selection, the events that you want to track will be shown on your dashboard and the metrics of choice will be presented. It offers a free Starter plan and two other plans that require you to pay a monthly subscription fee.
3. The AdWords Performance Grader
PPC is a common way of reaching new customers and growing businesses among marketers.
However, there are many factors that will determine your success as a PPC marketer. It can even be overwhelming to determine the right areas to which you should pay attention. That’s why PPC marketers need AdWords Performance Grader.
The Adwords Performance Grader helps you evaluate the strength of your Google Ads account quickly and securely. Once the tool has performed an audit of your account, it will give you a detailed report that shows the strengths and weaknesses of your account.
This can help you know the account elements that need more work. You can use this tool for free.
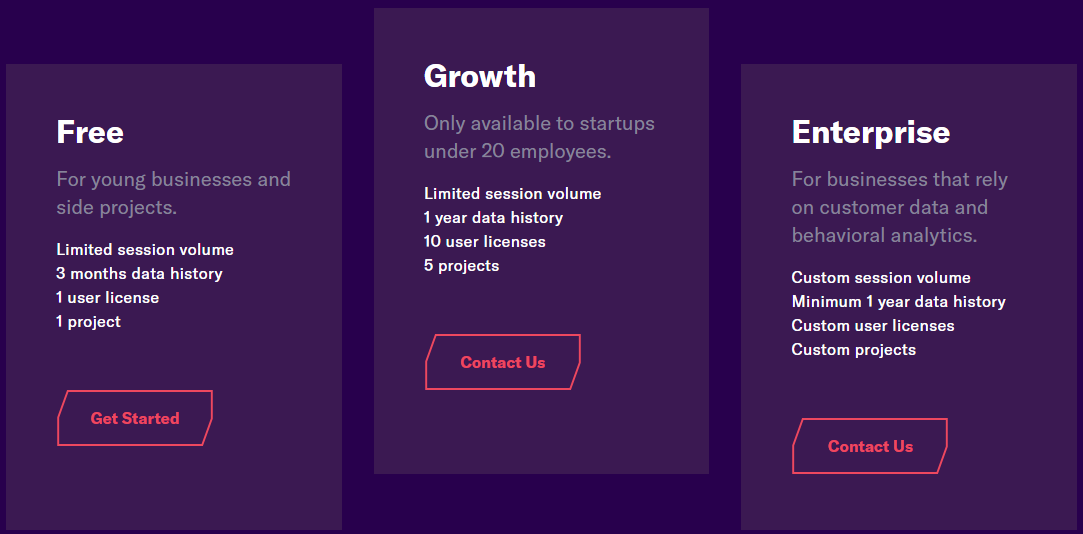
4. Heap Analytics
Heap is a web and mobile analytics tool, with similar functionalities as MixPanel. Heap Analytics helps you track all the activities taken by your website visitors. You can also use it to select the events that you need to analyze and preview on your dashboard. It can help you to track the individual user behavior and segment users based on their behavior.
It has a free plan and two other plans that require you to pay a monthly subscription fee.
5. Cyfe
Cyfe is an all-in-one dashboard that allows marketers to integrate data from various marketing tools and see all of it in one place.
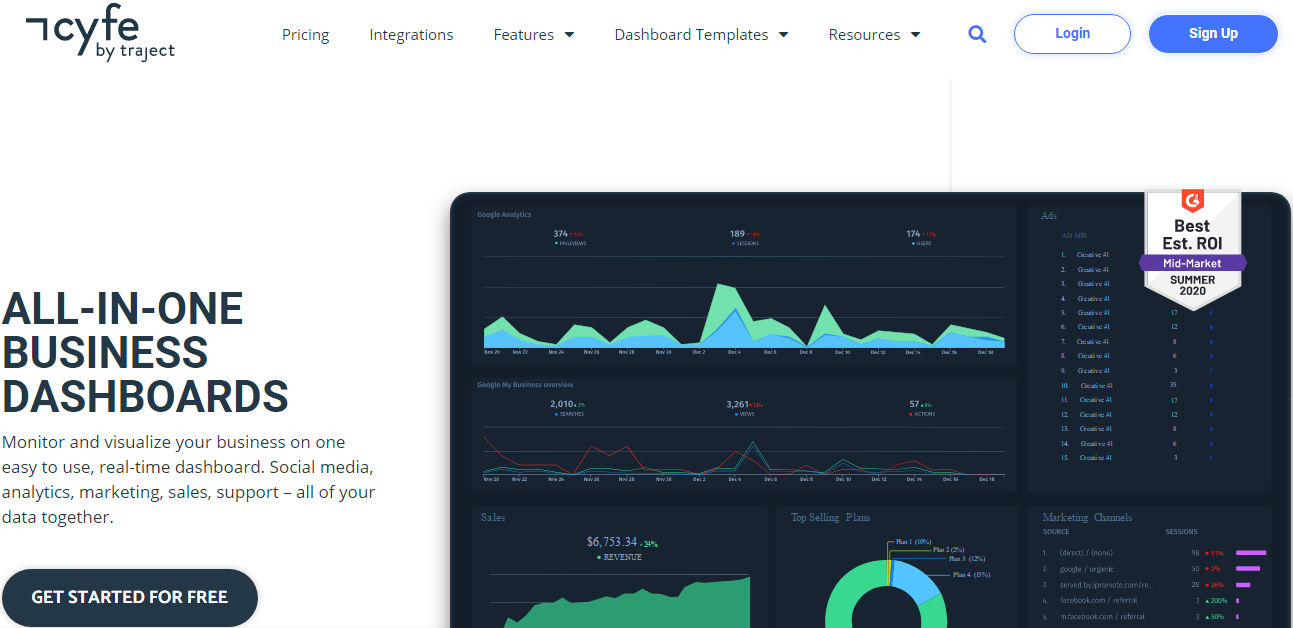
You can use it to track data from all your social media marketing platforms, sales platforms, pay per click marketing channels, and others. It has pre-built widgets that you can use to connect to Google Analytics, Google AdWords, and SalesForce accounts.
Cyfe can then collect all the data that you need from these platforms and display it on one dashboard. Cyfe has a free plan and three other plans that require you to pay a monthly subscription fee.

6. Klipfolio
Klipfolio is a dashboard software that allows its users to create interactive dashboards that can host marketing-related data from various tools and channels.
You can use it to pull data from Facebook or Google Analytics, which is good for tracking your performance and seeing all the data in an integrated dashboard. It comes with pre-built templates of dashboards that you can use without having to create your own from scratch.
However, you can still create your own dashboard that will help you meet your needs. If you have many marketing channels and you need to monitor their data in one dashboard, use Klipfolio. It has 4 pricing plans that require you to pay a monthly subscription fee. These plans majorly differ based on the size of teams.

7. Optimizely
Optimizely is a good tool for carrying out A/B tests on web pages and products to know which version is the best.
The A/B tests can be visual or textual, and Optimizely makes it easy for you to change the design of the pages without changing the code. It can also be integrated with other analytics tools like Bizble, Google Analytics, and Clicktale. Such experiments make it easy for you to track your Optimizely experiment results in other dashboards together with additional data segmentation.
It is a good tool for any marketer who cares about the performance of his website and online marketing results. Its A/B testing capabilities can help you know how to better convert your users and increase your ROI. It has different pricing plans that are based on traffic needs.
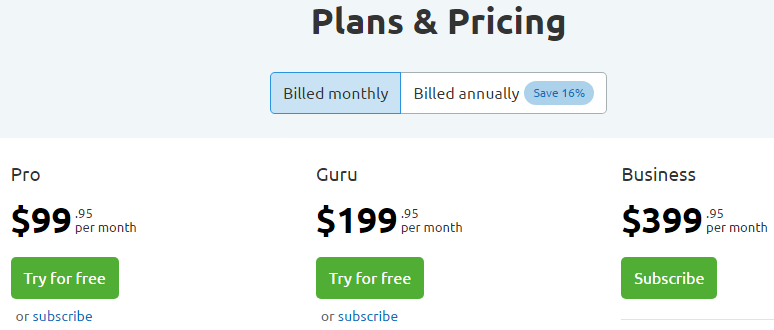
8. SEMrush
SEMrush is a marketing analytics tool that can help you see what your competitors are doing.
It can provide you with a way to outrank your competitors in search results and offers its users with a simple way to monitor their competitors’ social media accounts, brands, etc.
You can also use it to track your own brand. SEMrush has an analytics reports tool that shows the keywords that your competitors are using in their AdWords campaigns. You can also use it to analyze the keywords that you want to use in your ad campaigns to know how competitive they are.
It is a good tool for marketers who need to increase their search engine traffic and monitor their competitors’ activities. SEMrush offers 3 pricing plans, with the cheapest plan costing $99 per month.
9. BuzzSumo
BuzzSumo is a versatile content and social media analysis dashboard that provides its users with data about the topics that are trending on the major social media platforms. It allows you to analyze data from a range of different time periods, like for the previous 12 hours or spanning many months.
This way, you can now the topics in your industry that are getting the most social traction. It also offers advanced keyword search operators, backlink information, content type filters, and influencer marketing features. You can then export the data into another format and analyze it to a greater depth.
It has three pricing plans, with the cheapest plan going for $99 per month.
10. Crowdbooster
It is a social media analytics software that allows you to see the performance of social media ad campaigns through a series of simple dashboards.
One of the major advantages of using this tool is its real-time reporting functionality, which gives up-to-the-second data regarding who is engaging your content on social media and how. It also lets you see your most engaged fans and followers, and gives you recommendations on how to reach these brand ambassadors, as well as how to customize your social media content for a greater engagement. It offers different pricing plans, with the cheapest plan costing $9 per month
types of marketing analytics
They are:
- Descriptive analytics
- Predictive analytics
- Prescriptive analytics
There is some overlap between these three approaches. Marketers should implement all three to get a full view of their environment and to extract the most value out of their big data.
What Is Descriptive Analytics?
Descriptive analytics is focused on answering, “What happened?” In this analysis, real-time and historical data are used to understand where you were, where you are now, and how the difference between these two points can help you thrive in the future.
Ultimately, it is used to figure out why failure or success happened. For example, if a particular keyword in your PPC campaigns used to generate thousands of impressions a day, but now only sees a hundred, what happened? Are people no longer interested in this topic? Has something changed that the query is no longer relevant? Descriptive analytics aims to find out.
Any time you look at how your metrics have changed in the last quarter, month, and week or even the last day, you’re conducting a descriptive analysis.
What Is Predictive Analytics?
Instead of figuring out what happened, predictive analytics looks to the future and tries to answer: “What’s maybe going to happen?” As hinted above, predictive analytics often uses the insights found during a descriptive analysis. After all, you don’t know where you’re going unless you know where you’ve been, right?
Predictive analytics has limitations, hence the “maybe.” It is not a crystal ball and there is no perfect guarantee that the results of this analysis will be 100% accurate. Instead, predictive analytics makes data-informed guesses about the probability of a certain event occurring.
It’s the same model used to forecast the weather or create a credit score. Meteorologists look at weather data to predict temperatures, rainfall, and other natural events. It’s not uncommon for these forecasts to be off or entirely incorrect — the results of data misinterpretation! Similarly, credit scores are basically the finance industry’s way of predicting how likely you are to pay back a loan on time.
For PPC, predictive analytics can be used to make proactive campaigns that don’t just react to changes, but plan ahead for them. It can be used to identify the early stages of a growing trend and predict when it will hit a point of criticality.
What Is Prescriptive Analytics?
First, you find insights based on your historical performance (descriptive analytics). Then, you use those insights to forecast what the future may look like (predictive analytics). What’s the next step? Prescriptive analytics is about choosing what to do about it all. How do you change the course of your analytics for the better?
Compared to the other types of marketing analytics, the prescriptive variety is notably more complex. You’re not just looking at your internal data, but also external factors that may be influencing the numbers.
The goal is to optimize the data to reach the best possible outcome. To do that, you need to first understand which decisions will lead to that best-case outcome. This is known as stochastic optimization. In this respect, prescriptive analytics answers two questions, instead of one:
- What will happen if…?
- What should be done to reach the desired outcome?
The complexity of prescriptive analytics leads to the highest number of data misinterpretations. However, when conducted properly and accurately, this type of analysis leads to the most significant impacts on the success of a PPC campaign and the overall growth of a business.
In PPC, for example, prescriptive analytics can be used to answer questions like, “What will happen if I increase my budget by $500 a month?” Or, “What new keywords do I need to target if I want to increase revenue by 12% this month?”
Other Analysis Types
Descriptive, predictive, and prescriptive analytics are all necessary for exploring the data generated by your PPC campaigns. However, you also need to incorporate external data from other sources. This may require you to use other types of marketing analytics than the three just described.
Sentiment Analysis: Customer sentiments control how your target audience perceives your brand and products. In short, it’s how the audience feels about you. These sentiments can impact your PPC performance. If sentiments are overwhelmingly positive, people will be more likely to convert. If those sentiments are negative, they won’t even bother clicking.
Sentiment analysis looks for positive, neutral, and negative responses and feelings from reviews, social media responses, and other sources. This data can be an influential variable for your PPC metrics.
Competitive Analysis: Your competitors have a very significant impact on your PPC campaigns. There is a high chance that you are competing directly with these neighbors for ad ranks and clicks. The moves that these other entities make are important variables to consider when analyzing your PPC performance.
Given their impact, you need to have a keen eye on the competition at all times. A competitive analysis will compare and contrast the strengths, weaknesses, and strategies of each competitor, which may offer you valuable insight into how to approach your PPC marketplace more successfully. Plus, you won’t be caught off guard by shifts in the competition’s strategies.
Conclusion
Let us know your thoughts in the comment section below.
Check out other publications to gain access to more digital resources if you are just starting out with Flux Resource.
Also contact us today to optimize your business(s)/Brand(s) for Search Engines