Google Search Console (previously known as the Google Webmaster Tools) is a very useful tool for optimising your website. You can use it to find out how many times pages from your site have been included in Google’s search results, and how often they have been clicked on. And if you are having any trouble with your site, it will notify you of this too.
Google Search Console helps you identify and fix errors on your website, submit a new sitemap
The tool is free for anyone to use, and you can sign up for one here.
It’s important that the Google Search Console is used correctly in order to get the most out of it. If you don’t follow the guidelines, then your website could be punished by Google and not show up in the search results.
We have created a guide on how to use the Google Search Console that includes video tutorials and PDFs so that you can follow along easily.
Google Search Console Seo Tools
Measuring your website’s performance can help you gather insights on what’s important to your audience, how they’re finding your content and whether that content is actually surfacing in search results. Google Search Console is a collection of free tools and reports to help site owners and SEO professionals do just that.
How Google Search Console can help you manage your website
Google Search Console (GSC) is a wealth of information for websites of all kinds, but especially for sites that represent brands and businesses. It can help you identify which search terms people are using to find your site as well as analyze important metrics like your average position in Google search, clicks and impressions.
You can also use GSC to navigate technical issues to ensure that your pages are getting properly indexed and are accessible to searchers. GSC will even send you email alerts when it detects site issues and you can also notify Google after you’ve fixed those issues.
The features mentioned above are just the basics, but they’re all critical aspects of maintaining your site so that it can continue to further your business or brand. There’s much more that GSC can help you do, but first, you’ll need to set up GSC for your site.
Setting up Google Search Console for your website
To get started, head over to the GSC landing page and click “Start now.” After that, you’ll need to sign in to the Google account that you’d like to associate with your site’s Search Console account. If this is the first time you’re using Search Console, you’ll be asked what property type you’d like to create: a domain property or a URL prefix property.
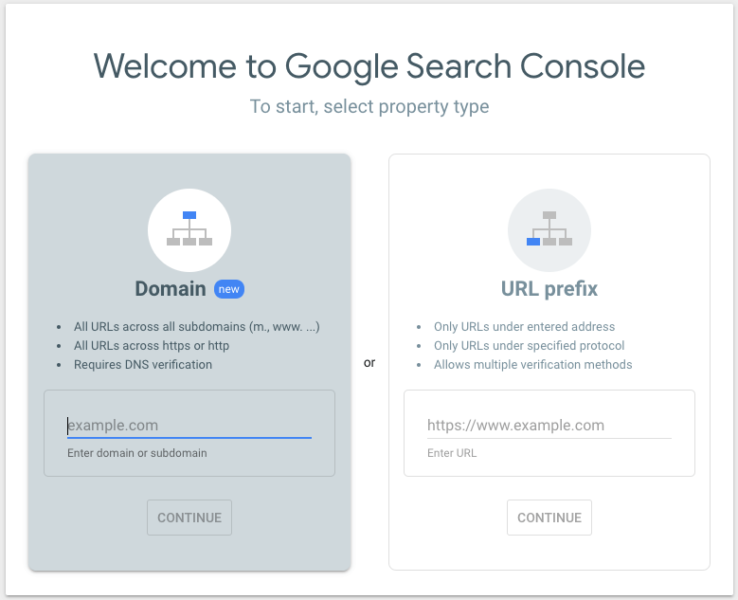
A domain-level property provides you with a comprehensive view of your site’s performance, including all URLs across all subdomains, on both HTTP and HTTPS.
A URL prefix property, on the other hand, includes only URLs with a specified prefix. This may be a good option if you’re looking to track specific subfolders, like http://m.example.com/ for your mobile site, for example.
Verification. A site’s GSC can contain a lot of information and settings that you wouldn’t want unauthorized individuals to have access to, which is why Google requires verification as part of the setup process. Adding a domain property requires you to very site ownership by adding a DNS record in your domain name provider — this is the only verification method for domain properties.

After you’ve added your domain, check if your domain registrar appears in the drop-down menu (shown above). If it does, select it to begin the automated authorization process. If your domain registrar isn’t on the list, you’ll need to copy the TXT record (the line of characters next to the “copy” button) and follow the verification instructions for your specific domain name provider. If the verification doesn’t succeed initially, Google recommends that you try again after a few hours as the change may take some time to take effect.
If you went with a URL prefix property instead of a domain property, then you can verify site ownership via HTML file upload, HTML tag, Google Analytics tracking code, Google Tag Manager container snippet, the above-mentioned domain name provider method and more.
Google Search Console’s most important features
Once you’ve verified site ownership, you can begin accessing GSC for your site. It’ll look something like the image below.
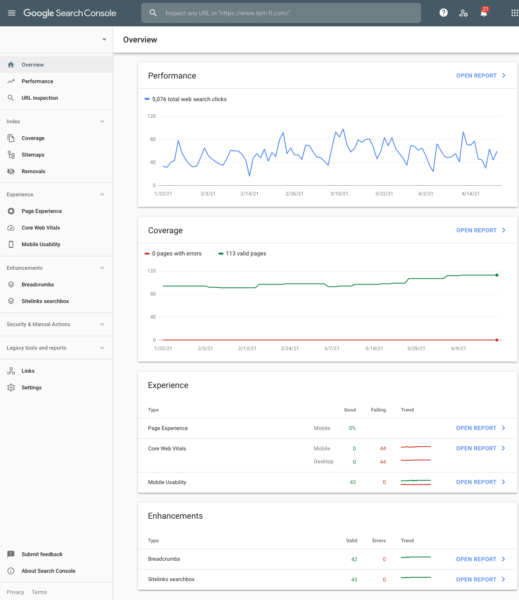
The primary sections are Performance, Coverage, Experience and Enhancements. You’ll have to get familiar with these sections/reports if you want to put GSC’s data and features to work for your site.
Performance reports. The Performance tab (located on the left-hand navigation panel) shows you data that can be used to inform your digital strategy. Since performance reports, and GSC as a whole, are such a flexible tool, we asked Search Engine Land Newsletter subscribers how they use it — we’ll be highlighting their experiences throughout this guide:
“Above all, my most used, and favourite feature of Google Search Console is ‘Performance on Search results’. The in-depth keyword, click, and impression data allows me to highlight more niche user searches in industries that are otherwise incredibly difficult to perform keyword research for. Where industry-renowned SEO tools will only show keyword data for higher volume keywords, Search Console lets you go granular, and really see what actual searches drive traffic to a website. This feature in particular also helps when it comes to informing my keyword assignment work, helps me to quickly identify trends, and additionally, develop further data-led content ideas.”
-Jade Dawson
All accounts will have data from Google search results in the Performance tab, but sites that have attracted meaningful traffic in Discover and Google News will also see reports specifically for those channels as well. Since traditional search performance is the most common scenario, we’ll be focusing on this aspect of the performance report. The information available here includes (but isn’t limited to):
- The top queries used to discover your content.
- Impressions (how often searchers see your site in Google’s search results).
- Clicks (how often they click on your site in Google’s search results).
- Average CTR (the percentage of impressions that resulted in a click).
- The average position of your site in search results.
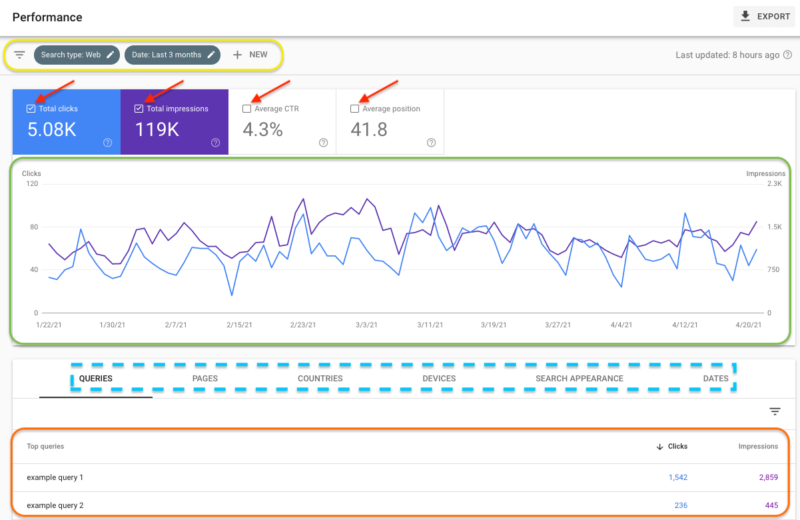
You can manipulate the report to show you the information you’re most interested in via the filter bar (circled in yellow), metrics options (indicated by the red arrows) and dimensions tabs (indicated by the hashed blue box).
- The filter bar enables you to filter the information by search type (web, image, video or news), date range (up to the last 16 months), query, page, country, device and search appearance (the search result type or feature).
- You can check or uncheck total clicks, total impressions, average CTR and average position to toggle the chart (indicated in green) to show the desired data over a given timeframe.
- The table (indicated in orange) provides you with an overview of clicks and impressions based on the dimension you’ve selected (queries, pages, countries, devices, search appearance and dates).
It’s a good idea to get comfortable using the filter bar. Experiment by clicking on the “+ New” button to reveal a menu that enables you to filter your data by query, page, country, device and search appearance.

You can also use these filters to compare two values. Try a new filter and edit or remove filters when you want to analyze something differently. The updated interface can be used to determine the value of keywords and whole sections of your site, traffic source by country, the type of devices searchers are using, and how Google is serving your pages.
“I love using the Performance Report and the included filters to identify cross-channel opportunities. Specifically, I apply the position filters to identify terms ranking just outside page 1 or just outside the local pack (we use GMB specific UTMs to differentiate these). Depending on what the destination URL looks like, I then determine whether onsite optimizations, internal linking, tech SEO, and/or link building are appropriate to improve rankings. I also use the Performance Report to define Search Network terms to bid on and to define new content opportunities (which supports existing and new keyword ranking potential). I’m a big believer in integrated marketing. Search Console, especially the Performance Report, makes that much easier.
-Matt Messenger
Index Coverage reports. This report shows the status of your site’s URLs within Google’s index and is used to troubleshoot technical SEO issues that can prevent your pages from showing up in search.
“My favorite search console feature is the Coverage feature. It shows you any errors that may be keeping your site’s pages out of the search results and explains how to fix the issues. Not knowing about errors on your site can cost you visitors and conversions. Use the information it gives you to fix issues such as text that is too small to read or content wider than the screen on the mobile view of a website. Fixing issues like these helps improve your viewer’s experience for better results.”
-Christina Drews Leonard
Google will email you when it detects a new index coverage issue on your site, but it won’t email you if an existing issue becomes worse. It’s a good idea to check this report from time to time to ensure that any issues are under control.

Similar to the Performance report, toggling the “error,” “valid with warnings,” “valid” and “excluded” options will refresh the chart to show the desired data. Here’s what each of those options means.
- Error: The page is not indexed and does not appear in Google search results. Clicking on a particular type of error (in the table below the chart) will show you the URLs that the error applies to, which can get you on the path to resolving them.
- Valid with warnings: These pages are indexed and may or may not be appearing in Google search results. GSC uses this designation because it thinks there’s a problem you should be aware of.
- Valid: This indicates that a page is indexed and showing in Google search results — there’s no need for further action (unless you don’t want the page to be indexed).
- Excluded: These pages are not indexed and are not labeled as having an error because Google thinks it is your intention to have these pages excluded. This can happen when a page has a noindex directive or there’s an alternate page with a canonical tag, for example.
If you’re steadily creating new content, your number of indexed pages should be trending upward. You may see them trending downward if you’re merging or getting rid of content that no longer serves a purpose. If there’s a sudden dip in indexed pages (that isn’t warranted by something you did, like merging content), that may indicate that there’s an issue preventing Google from indexing your content. Google’s Index Coverage report help page contains a full list of errors that you can use to resolve issues that are stopping Google from indexing your URLs.
Page Experience report. Google added this report to GSC ahead of its page experience update. The report combines the core web vitals report with the other metrics that are part of the page experience update. Core web vitals data comes from the Chrome User Experience (CrUX) report, which gathers anonymized performance metrics from real visitors to your site.
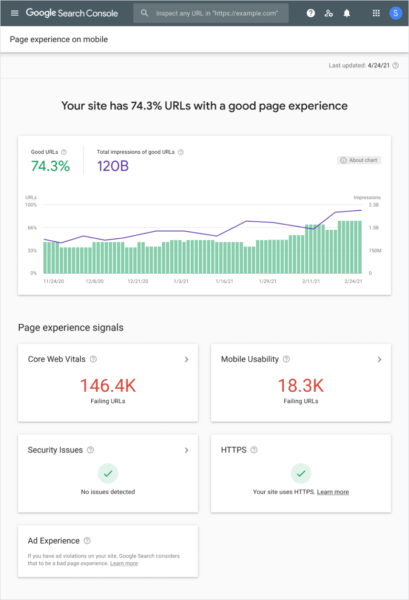
At a glance, the Page Experience report shows you…
- The percentage of “Good URLs” — the proportion of mobile URLs that have a “good” Core Web Vitals status and no mobile usability issues, according to the Mobile Usability report.
- The total impressions you’re getting from good URLs.
- The number of “Failing URLs” in Core Web Vitals (URLs designated as “Poor” or “Need improvement”).
- Any security issues that may prevent your site from being considered as delivering a good page experience.
- And, whether a significant number of your pages use HTTP instead of HTTPS.
Google has said that great content will continue to be a more important factor than page experience, and that great content with a poor page experience may still rank highly. However, if the quality of your content is similar to that of your competitors, providing a positive page experience may give you an edge in the search results, and paying attention to this report can help you deliver that experience.
Enhancements reports. Similar to the Index Coverage report, these reports show you trends for errors, valid pages with errors and valid pages. Pages with errors aren’t shown in Google search results. Pages with warnings can be shown in results, but the errors may be preventing them from showing in places that they might otherwise be eligible to appear, like the Top Stories carousel in the case of AMP pages, for example.
If you’re using AMP (Accelerated Mobile Pages), Google’s framework designed to make pages faster for mobile device users by serving them via its own cache, then you’ll see the AMP status report within the Enhancements section of your GSC. As a side note, one of AMP’s biggest draws was eligibility to appear in the Top Stories carousel; when the page experience update rolls out, Google will also lift this restriction, enabling pages that perform well on page experience to appear in this coveted search feature.
The unparsable structured data report aggregates structured data syntax errors. These are covered within this report instead of the report for the specific feature (like event or job rich results, for example) because the errors may be preventing Google from identifying the feature type.
More reports can appear in the Enhancements tab depending on the structured data markup you’ve implemented. These can include reports for breadcrumb, video, logo and sitelinks searchbox markup, to name a few. Zooming in on a specific error type within any given report will also present you with a “validate fix” button — this can be used to communicate to Google that you’ve resolved an issue that was preventing the search engine from properly accessing a part of your site.
Troubleshooting with Google Search Console
The Index Coverage and Enhancements reports already provide you with much of the information you’ll need to resolve indexing issues. In addition to those resources, GSC also offers the URL inspection tool and manual actions report to help you fix problems that can prevent your pages from showing in Google search.
The URL inspection tool. This feature enables you to access information about Google’s indexed version of a given page. It’s especially useful because it consolidates all the errors associated with a page in one place.
“[The] URL inspector is a great tool. We have about a dozen webpages that drive most of our online revenue, so being able to focus in on those is great — seeing any outstanding issues and assessing the performance of those specific pages is really important for us.”
-Rachel Jaynes
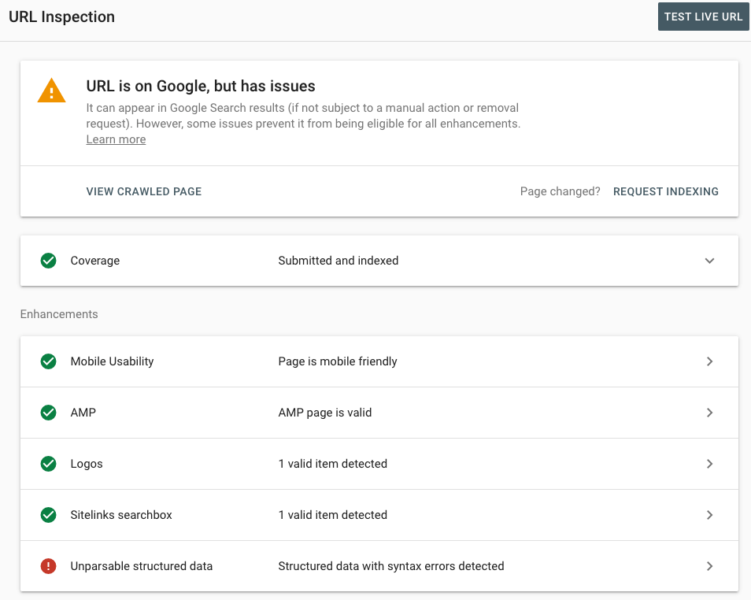
You can see the current index status of a page, AMP or structured data errors and much more. There’s also a “test live URL” button at the top-right-hand corner of the page that enables you to see if the page can be indexed; it’s especially useful for testing whether issues still exist after you’ve implemented a fix.
You can also use the request indexing tool if you want Google to reindex your page (although indexing is not guaranteed). This is also useful after you’ve fixed errors or made substantial changes to a page.
“I love being able to see whether a page is indexed and request indexing if it’s not. It makes getting new pages or changes indexed quick and easy.”
-Kym Merrill
The manual actions report. Manual actions are issued by Google when one of its human reviewers determines that page(s) on a site don’t meet the company’s webmaster quality guidelines. These violations can include hidden text, participating in link schemes and abusing structured data, to name a few examples. The consequences of a manual action can range from lower rankings for certain pages to the entire site being omitted from search results.
You’ll receive an email if Google issues a manual action for your site. The main overview section of your GSC will also show any manual actions; these are accessible in the manual actions section (within the left-hand navigation panel) of your GSC as well. Click on the detected issue to expand the description and review a sample of the affected pages. The description also contains a link that can help you learn how to resolve that particular manual action. After you’ve fixed all of the issues, you can request that Google review your site by clicking on the “request review” button. This process can take several days to a week, and Google will email you notifications regarding the progress of the review.
google analytics
Google Analytics offers an easy and free way to track and analyze visitors on your website. You could have thousands or even millions of visitors every month, but those visitors are practically meaningless if you don’t know anything about them. With its robust web analytics and reporting tools, Google Analytics can help you make the most out of visitors and potentially turn them into customers.
In addition to tracking the number of visitors, Google Analytics provides key insights into how your website is performing and what you can do to meet your goals. You can track everything from how much traffic your website is getting to where that traffic is coming from and how visitors are behaving. You can even monitor social media activities, track mobile app traffic, identify trends and integrate other data sources to help you make well-informed business decisions.
Here’s how to use Google Analytics for your website.
Google Analytics Basics
If you want to skip the details and just get started, here’s a rundown of how to set up Google Analytics on your website:
• Sign in to Google Analytics with your Google account
• Click the Admin button on the bottom left sidebar of your dashboard
• Select an account or create an account
• Click on the dropdown menu to create a property
• Click on Website and add your site’s name and URL
• Choose your industry
• Choose your time zone
• Click on Get Tracking ID
• Install Tracking ID on your website
Here are also a few terms you should know:
Account — where each property lives in your dashboard. You can set up multiple properties in one account or have multiple accounts for different properties
Property — the website or mobile app you want to track
Tracking ID — a unique code added to your site that allows Google Analytics to track it
Conversion — visits that turn into customers or potential customers
Channel/Traffic source — shows where your traffic came from, such as referrals or links from other sites, search engines, social media and emails
Session duration — how long visitors spend on your site
Bounce rate — percentage of visitors that view only a single page and then leave
Event — specific visitor behavior, such as when a visitor clicks on an ad, watches or stops a video, downloads a file and more
Landing page — the first page a visitor sees when visiting your website
Organic search — visitors who visit your site from a link on a search results page
Segment — a way to filter data, such as by category and types of visitors
And the types of reports you shouldn’t miss:
Acquisition — shows you where traffic comes from, such as search engines, social media, email marketing campaigns and links from other websites. You’ll find this under the Acquisition tab.
Keywords — tells you what search words visitors used to find your website on a search engine. You’ll find this report in the Behavior tab, under Site Search.
Conversions — tracks how many visitors are converting into newsletter subscribers, shoppers and actual customers. Click on the Conversions tab and choose a type or category of conversion to view a report.
Lifetime value — currently in beta, Lifetime Value reports track visitors throughout their lifetime, from their first visit to conversions, return visits, future purchases and beyond. This can help you figure out what turned these visitors into customers and what made them keep coming back so you can implement changes. Lifetime value is located under the Audience tab.
Landing page — shows you which pages are the most frequent landing pages so you can track down where those visitors are coming from and what’s working on those top pages that’s attracting customers. You’ll find this across different reports under the landing page column.
Active users — monitors how many visitors are actually active on your site within a specific time period, such as the past week, 14 days or month. This will show you what pages the most active users are visiting so you can figure out what’s keeping their attention and apply it to the rest of your website. You can find the active users report in the Audience tab under Active Users.
Now that you have the basics down, here’s more on using Google Analytics as a small business.
Sign up for a Google Analytics account
To use Google Analytics, you will need a Google account. Go to google.com/analytics. Click on Sign in or Create an Account on the upper left corner. If you’re already signed in, click on Access Google Analytics. Fill in the required information – account name, website name, URL, industry, time zone and data-sharing settings.
Click on Get Tracking ID to finish setting up your account.
Set up Google Analytics on your website
A <script> tracking code is required to track your website. You’ll be taken directly to the Tracking Code section after setting up your account. The tracking code must be on every page you wish to track. There are a few ways to do this:
• Copy and paste the code directly into your website template.
• Create a “analyticstracking.php” file with the code and add <?php include_once(“analyticstracking.php”) ?> after your template’s <body> tag.
• Check your web host, website builder or blog platform for Google Analytics integration. For instance, there are several plug-ins on WordPress that will automatically add the tracking code to every page. Some website builders have a specific page or field where you simply enter your tracking ID. Others — such as Blogger and Squarespace — require only your Google Analytics web property ID or account number, a string of numbers prefixed with the letters UA that identify your website.
Star tracking
One of the best things about Google Analytics is that it offers a range of metrics that users can customize to fit their needs. All of Google Analytics’ features can be accessed and configured from the left sidebar.
Here are three features that matter most to small businesses.
Traffic sources
Find out where your visitors and customers are coming from. Just click on the Acquisitions tab on the left sidebar and you’ll be able to view all traffic sources, such as channels, referrals and organic searches.
You’ll also be able to find which search terms visitors are using that led them to your website. Google Analytics automatically scans more than 20 major search engines, such as Google, Bing, Yahoo, MSN, AOL and, of course, all of Google’s properties. It also includes searches from international search engines like Baidu as well as searches from major websites like CNN.
Custom reports
Custom reports allow you to configure metrics based on your own categories that are not included in the default settings. For instance, if you own an online store, this section allows you to track traffic based on things such as size, color and product SKUs. You can also integrate external data sources, such as your customer relationship management (CRM) software. Just click on the Customization tab and create your metrics.
Social settings
It’s not enough to simply run a social media marketing campaign. It’s imperative that you track your results, too. Google Analytics can help by integrating social media into your tracking metrics. Although you can’t add your Google Analytics tracking code to your social media accounts, what you can do is add them under Social Settings. For instance, if you own a YouTube channel, you can track activities by adding your account using your YouTube URL.
To track social media campaigns, click on Acquisition on the left sidebar. Here you can add campaigns, track landing pages, monitor conversions and more.
4. Add users
Want other members of your team to view your Google Analytics account? All you’ll need are their email addresses. Click on the Admin tab in the left sidebar, choose an account and click on User Management. From here you can add new users and set permissions. For instance, you can limit users to reading and analyzing traffic or give them admin-level access to do things like edit your settings. Adding users also makes it easy to present reports and collaborate.
Conclusion
Let us know your thoughts in the comment section below.
Check out other publications to gain access to more digital resources if you are just starting out with Flux Resource.
Also contact us today to optimize your business(s)/Brand(s) for Search Engines
